
Spectrophotometric Determination of Standard Parameters in Wastewater
Fri 12 Mar, 2021
More efficient spectrophotometric analysis of pollutant parameters in wastewater
For many years, UV/Vis spectroscopy has been an established standard method with standardized procedural guidelines for the qualitative and quantitative analysis of a variety of parameters of wastewater such as nitrate (NO3), nitrite (NO2), ammonium (NH4), phosphate ions (PO4), and total phosphorus (Ptot) content. This article shows how you can make these standard analyses even more efficient while retaining full compliance with standards and regulations.
As supplies of drinking water and process water become increasingly scarce, a comprehensive qualitative and quantitative analysis of wastewater is essential for increasing quality of life and for improving public health. There are numerous national and international standards that, among other things, govern treatment processes or define limits regarding the content of certain harmful substances. There are also strict regulations pertaining to the analysis of individual parameters. These standardized measurements include detection of total phosphorus as well as phosphate, ammonium, nitrate, and nitrite ions in industrial and household wastewater. The first step in the purification of wastewater in treatment plants is the removal of solids using physical methods. In the biological stage that follows, bacteria and yeast control oxidation processes. These processes entail oxidation of the primarily organically bound nitrogen (in the form of proteins, nucleic acids, and urea) to NO3 and NO2. The third stage – the chemical treatment process – causes the precipitation of PO4.
The spectrophotometric analysis of these compounds (known as UV/Vis spectroscopy) is governed by the standard German process for water, wastewater, and sludge analysis (DIN 38405) as well as a variety of other standards. These provide detailed instructions for analysis, also with relation to sample preparation, interfering ions, and detection limits. There are similar guidelines and standards in many countries.
Although these measurements have been part of the standard repertoire of wastewater analysis methods for many years, there is still considerable potential for optimization in the analysis process. New challenges such as the growing number of samples or stricter requirements regarding analysis reliability necessitate greater efficiency in analysis solutions. Through the use of modern, highly sensitive spectrophotometers, software that relieves users of laborious tasks, and automation solutions for high sample throughputs, laboratories today are capable of saving much time and effort in the analysis process. The example analysis provided below, of total phosphorus, phosphate, ammonium, nitrate, and nitrite ions in wastewater, demonstrates the specific form this can take.
Instruments and software for optimum detection
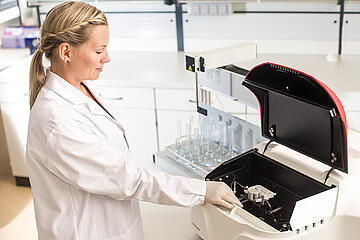
In this example measurement, the SPECORD 50 PLUS UV/Vis spectrophotometer was used. This is a device that offers high-resolution optics and a robust engineering design for precise, reliable data collection. The SPECORD 50 PLUS uses special split beam technology that makes it ideal for routine qualitative and quantitative photometric applications such as the detection of the standard parameters NO3, NO2, NH4, PO4, and Ptot in wastewater. This split beam technology enables samples to be illuminated with higher energy intensity. Analytik Jena’s SPECORD PLUS series also uses the optimized software and data solution ASpect UV, which guarantees quick, standard-compliant measurements and data analyses thanks to the simplicity of plotting calibration curves and preparing methods. The software settings for measurement are shown in Table 1.
Table 1: Software settings
| NH4 | NO2 | NO3 | PO4 | |
| Measurement mode | Absorbance | Absorbance | Absorbance | Absorbance |
| Wavelength [nm] | 655 | 540 | 338 | 880 |
| Integration time [s] | 0.2 | 0.2 | 0.2 | 0.2 |
| Regression | y = B * x | y = B * x | y = B * x | y = B * x |
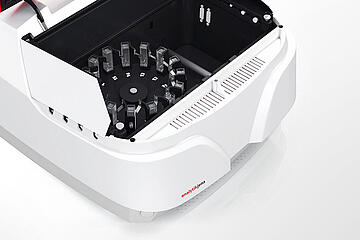
Where larger sample volumes are involved, the use of accessories is recommended to enable faster and easier handling of samples. Analytik Jena offers a variety of accessories such as a cuvette carousel with 15 positions or a 6-fold cuvette changer. In this example measurement, a 15-position cuvette carousel was used for the measurement of NH4, NO2, and NO3, while a 6-fold cuvette changer with 10 mm glass cuvettes was used for PO4 and Ptot analysis.
Fast measurements, reliable results
The samples were prepared in accordance with relevant standards and measured within the following times:
- NH4: 1–3 h
- NO3: 1 h
- NO2: 20 min
- PO4 / Ptot: 10–30 min
The baseline, blank, and sample values were measured one after the other. A baseline measurement was taken against air. For the blank sample, distilled water was used and treated identically to the wastewater samples. The absorbance of the blank sample was automatically subtracted from the subsequent samples. To determine the concentration of NH4, NO3, NO2, PO4, and Ptot, the first step was to plot the calibration curve based on the referenced standards, for which ten reference solutions of each reference substance were prepared with different concentrations according to the literature. Table 2 shows the different production conditions of the calibration standards and the preparation of the calibration curve for each parameter according to the referenced standards.
Table 2: Conditions for the creation of calibration curves according to standards
| Standard | Parameter | Concentration range | Reference compound | Wavelength |
| DIN 38406-05 | NH4 | 0.03 - 1 mg/L | Ammonium sulfate ((NH4)2SO4) | 655 nm |
| DIN 38406-9 | NO3 | 0.5 - 25.0 mg/L | Potassium nitrate (KNO3) | 338 nm |
| DIN EN 26777 | NO2 | up to 0.25 mg/L | Sodium nitrite (NaNO2) | 540 nm |
| DIN EN ISO 6878 | PO4 / Ptot | 0.005 - 0.8 mg/L | Potassium dihydrogen phosphate (KH2PO4) | 880 nm |
The calibration curve for NO3 is shown as an example in Figure 1. The absorbance of the blank measurement using distilled water is automatically deducted from the absorbance values of the measured calibration standards by the ASpect UV software. The calculated absorbance values of the calibration standard solutions are specified as a function (y-axis) of the concentrations of the standard solutions (x-axis). The latter is expressed in milligrams per liter (mg/L). The relationship between absorbance and concentration proves to be linear in the specified concentration range. The ASpect UV software automatically calculates the slope and R² value of the calibration curve. The concentration of the unknown samples is calculated automatically in relation to the measured absorbance. The concentration is also automatically calculated if information about the dilution and weight of the sample are provided. This eliminates the risk of calculation errors and allows the user to save valuable laboratory time.
When analyzing wastewater samples, it is important to be aware that the effect of other substances on absorbance must be determined before the measurements are performed, as interfering ions (NO3 and NO2: chloride; PO4: arsenate) can affect the test results significantly. If it can be demonstrated that interfering ions are not present, the wastewater samples are treated with the detection reagents described in the standards. The absorbance of the wastewater samples is then measured and the concentration is determined using the calibration curve. If the selected parameters are measured frequently, the use of the Quickstart function is recommended in order to store the methods and calibration curves (see Figure 2) for later use. This enables rapid and precise measurement of additional samples. Once the software has been opened, the method is launched and the results are automatically recorded and analyzed in just four clicks (the sample sequence, including the number of samples and sample names, can also be modified).
Five water samples were collected from the treatment plant after purification. The results are shown in Table 3. Continuous monitoring of the concentration of various parameters makes it possible to study the wastewater purification process in treatment plants. The measurement data are collected and saved so that public authorities can verify that the limits have been adhered to. It is also possible to continuously improve and optimize the purification process.
Table 3: Concentration of the selected parameters exemplified for five wastewater samples from a sewage treatment plant
| Sample | NH4 | NO2 | NO3 | Ptot | PO4 |
| 1 | 0.5035 | 0.4839 | 12.2777 | 0.2066 | - |
| 2 | 0.0237 | 0.0079 | 5.8712 | 0.1991 | 0.0666 |
| 3 | 0.0813 | 0.0305 | 6.7569 | 0.2237 | 0.0724 |
| 4 | 0.0194 | 0.0157 | 5.0116 | 0.0246 | - |
| 5 | 0.0105 | 0.0139 | 3.8557 | 0.0267 | - |
Ammonium may be present in different species in wastewater samples, depending on the pH value of the solvent (as ammonium ions (NH4+), ammonia (NH3), or ammonium hydroxide (NH4OH)). To detect all possible ammonium species and thus obtain reliable results regardless of the origin and pH value of the wastewater, heavily alkaline conditions are necessary. Conversely, to detect NO3 and NO2 ions, highly acidic solutions are needed to catalyze the formation of the colored target compounds, which can be detected at their characteristic wavelengths. Given the extreme pH values of the solvents, handling the samples is a complicated process. Also, the use of large quantities of solvents should be avoided to limit the amount of waste that requires special disposal measures. This is why measurements should ideally be performed in 10 mm cuvettes, though the standards also permit the use of 40 mm or 50 mm cuvettes. Another advantage of using 10 mm cuvettes rather than 40 mm or 50 mm cuvettes is the increased capacity for sample automation. While 40 mm or 50 mm cuvettes only fit individually or can only be positioned in a 6-fold cuvette changer, the 10 mm cuvettes can also be used in a cuvette carousel with 15 positions or an 8-fold cuvette changer. Additional steps can be automated using the sipper system and APG Autosampler, which is also in Analytik Jena’s accessory portfolio. The SPECORD PLUS series UV/Vis spectrophotometers are especially suitable for the analysis of wastewater samples as they feature a special cuvette position for turbid samples. The cuvette can be placed closely to the detector, which reduces the amount of stray light. Standardized test kits can be used for water analysis parameters such as SAC, turbidity, COD, BOD, sulfate, and many more with the round cuvette holder. Low-concentration samples can be analyzed using the 100 mm cell holder to magnify layer thicknesses with ease.
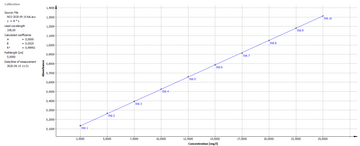
Figure 1: Calibration curve for the determination of concentration of NO3.
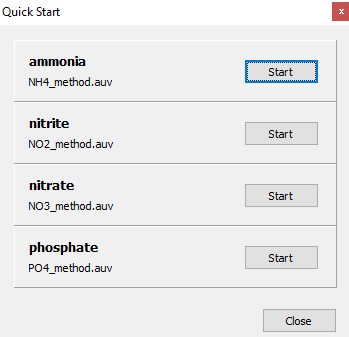
Figure 2: Quick Start menu of the ASpect UV software

Complete solution from Analytik Jena for detecting harmful substances in wastewater
The SPECORD 50 PLUS used for the example study is a modern UV/Vis solution that combines powerful technology with user-friendliness. This spectrophotometer determines the concentrations of key water parameters in wastewater samples quickly, precisely, and easily. The SPECORD 50 PLUS’s features also include high-precision optics, which ensure calibration curves with very good R² values. Automatic calculation of the concentration value in relation to dilution and original sample weight is especially user-friendly with the ASpect UV software. This relieves the user of many tedious, time-consuming tasks and provides quick and error-free calculation of the concentration of various parameters in wastewater samples. Thanks to a wide range of accessories, Analytik Jena’s SPECORD PLUS series of UV/Vis spectrophotometers can be adapted to the requirements of many applications. For example, autosamplers, cuvette changers or carousels are recommended for high-throughput analyses, while additional accessories allow analysis of turbid or low-concentration samples.

Related Downloads

")
Leave a comment
Write new comment
Contact
The newsletter of Analytik Jena frequently keeps you posted about:
- News
- Trends and developments
- Events
Comments (0)
No comments found!